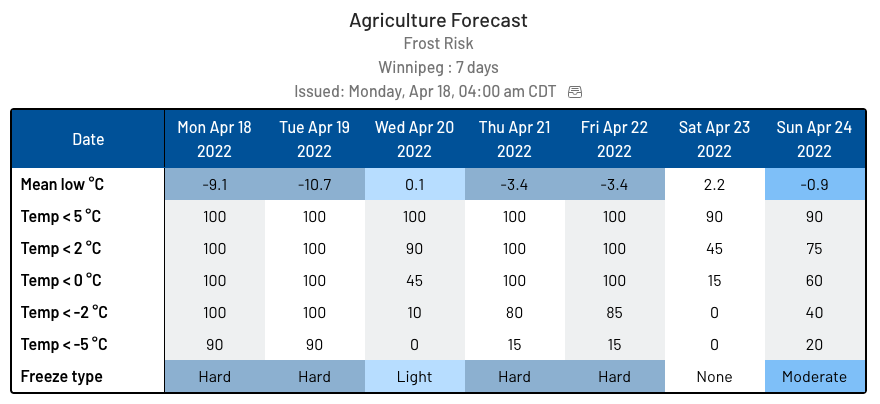
App Feature: Agriculture Risk Tables

Please share this post

Facebook
Twitter
LinkedIn
Email
Reddit

Available in the Weatherlogics App 

for Agriculture Premium Subscriptions 


Frost, Disease, and Spray risk tables – What are they and how do they work?

Getting Started

On the Ag Risk page you can view colour-coded frost, disease, and spray forecast tables. Here are some steps to get started viewing agriculture risk in your area:
  1. To get started, view the Ag Risk page. It is available under the “Table Forecasts” menu.
  2. In the options panel you can select a past date using the archives button to look at previous forecasts.
  3. Click the other tabs to view the disease and spray tables.
  4. You can use the star icon in the toolbar to favourite an agriculture risk table. Your favourite is the first page shown when the app first loads. 

Notes: Our spray, frost, and disease forecasts are based on weather data closest to you. The spray forecast categorizes risk based on government guidelines for spraying. The disease forecasts are based on scientifically-reviewed crop forecasting models.

What is available in the Agriculture Risk Tables?

🌡️ Frost Risk Table
  • Predicted low temperature
  • Frost and hard freeze probabilities 
  • Freeze severity type
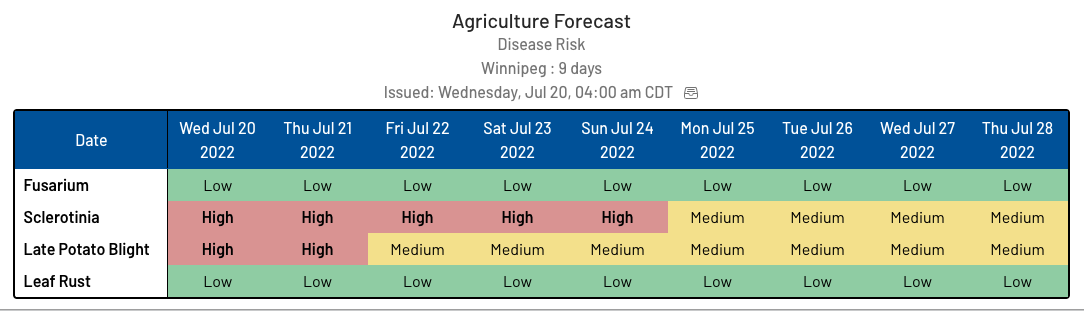
🍂 Disease Risk Table
  • Fusarium head blight
  • Sclerotinia
  • Late Potato Blight
  • Leaf Rust
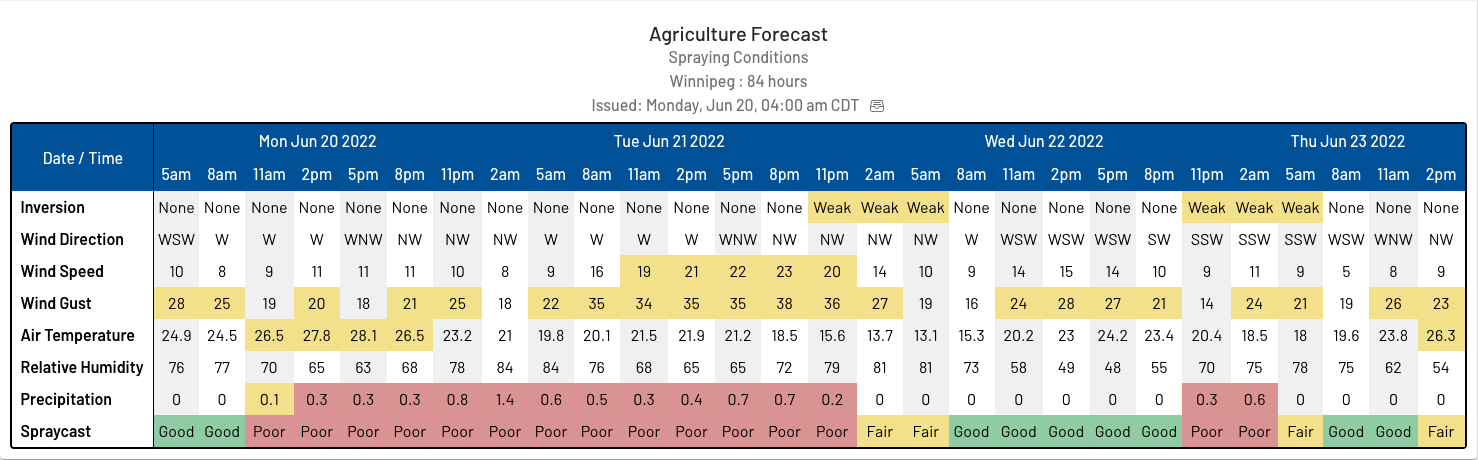
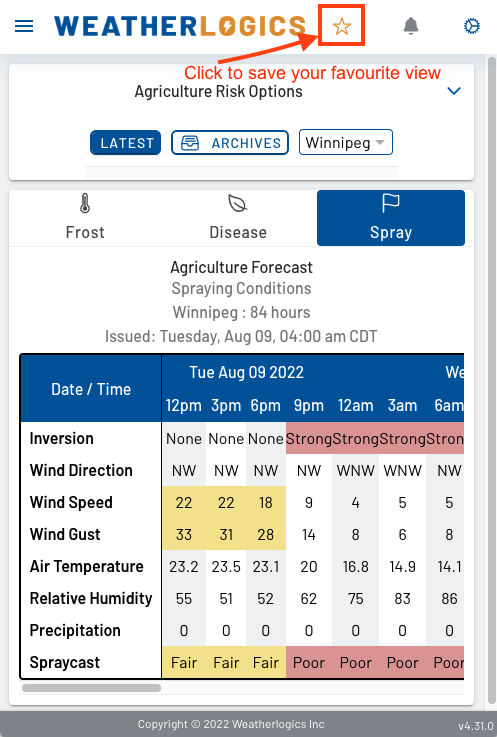
💨 Spray Forecast Table
  • Inversion strength
  • Wind direction, speed, gust
  • Air temperature
  • Relative humidity
  • Spray forecast recommendation

Agriculture Risk Spray Forecast 

Watch the video below for an explanation of the how the spray forecast works.

➕ More to Explore

There’s so much to explore in the Weatherlogics app. Here are some other features to check out! We look forward to highlighting these app features in future blog posts.
 
Basic Subscriptions
  • You can view weather radar on the interactive map
  • Forecast graphs and tables
  • More forecast maps than those included in your daily email
 
Premium Subscriptions
  • Everything in the basic subscription, plus more!
  • Create custom alerts from weather stations or create forecast alerts on the table forecast page to know when the forecast is showing specific conditions
  • View road forecasts on the interactive map and click any location for a point forecast

More to explore

What Happened to El Niño?

The Prairies are in the midst of record cold weather. Alberta has seen air temperatures plummet as low as -50 C, causing

Try Our App!

🌪️☀️🌨️ Calling all weather enthusiasts! Be among the first to experience our new weather app! Just visit the link below to download

Transportation Pilot Project

Why did we take on this project? Road safety is of critical importance to all Canadians. In a large country like Canada,