Warm and Dry September
The Weatherlogics September weather story was a return to warm and dry weather across the Prairies. Every station in our climate summary was warmer than normal in September and all but four were drier than normal. Winnipeg, MB also recorded its 35th thirty degree day of the year on September 29, tying the record for most thirty degree days in a year, set back in 1988. The weather pattern looks to remain warm and dry as we move into October.
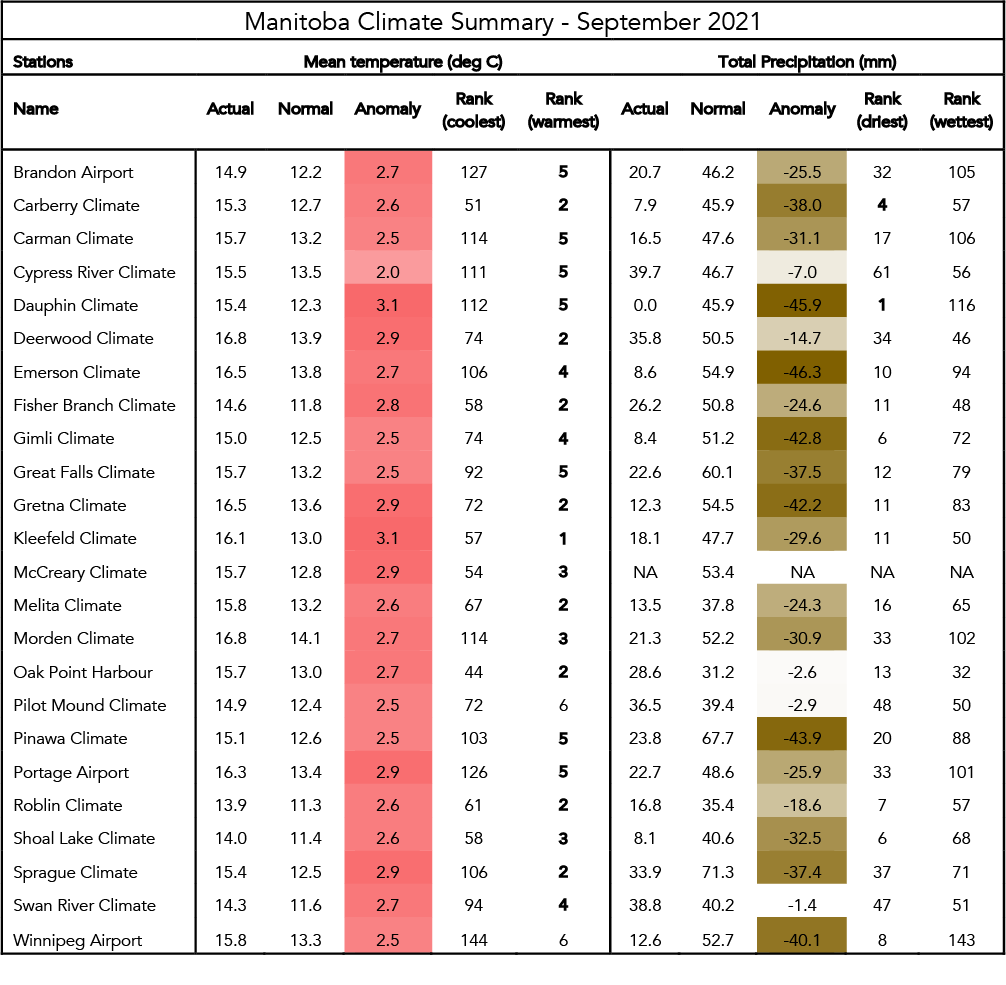
Manitoba
- Winnipeg, MB: Tied record for most thirty degree days in a year with 35 in 2021
- Dauphin, MB: No rain in September, making it the driest September on record
- Every station in our Manitoba summary was drier than normal in September
- Every station in our Manitoba summary was warmer than normal
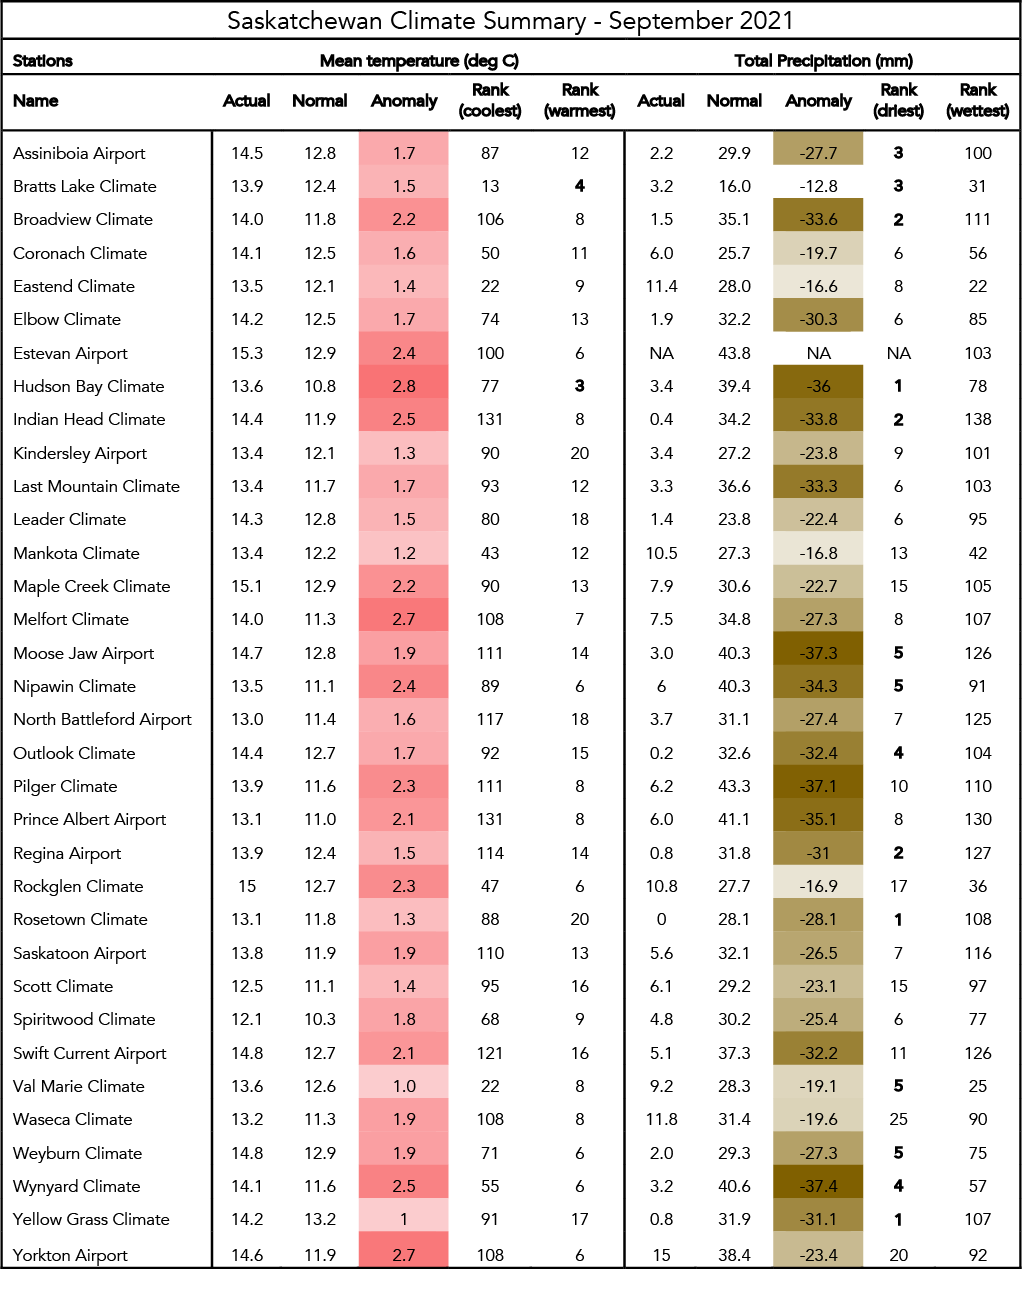
Saskatchewan
- Three stations recorded their driest September on record: Hudson Bay, Rosetown, and Yellow Grass
- Three stations recorded their second driest September on record: Regina, Broadview, and Indian Head
- Every station in our Saskatchewan summary was drier than normal in September
- Every station in our Saskatchewan summary was warmer than normal
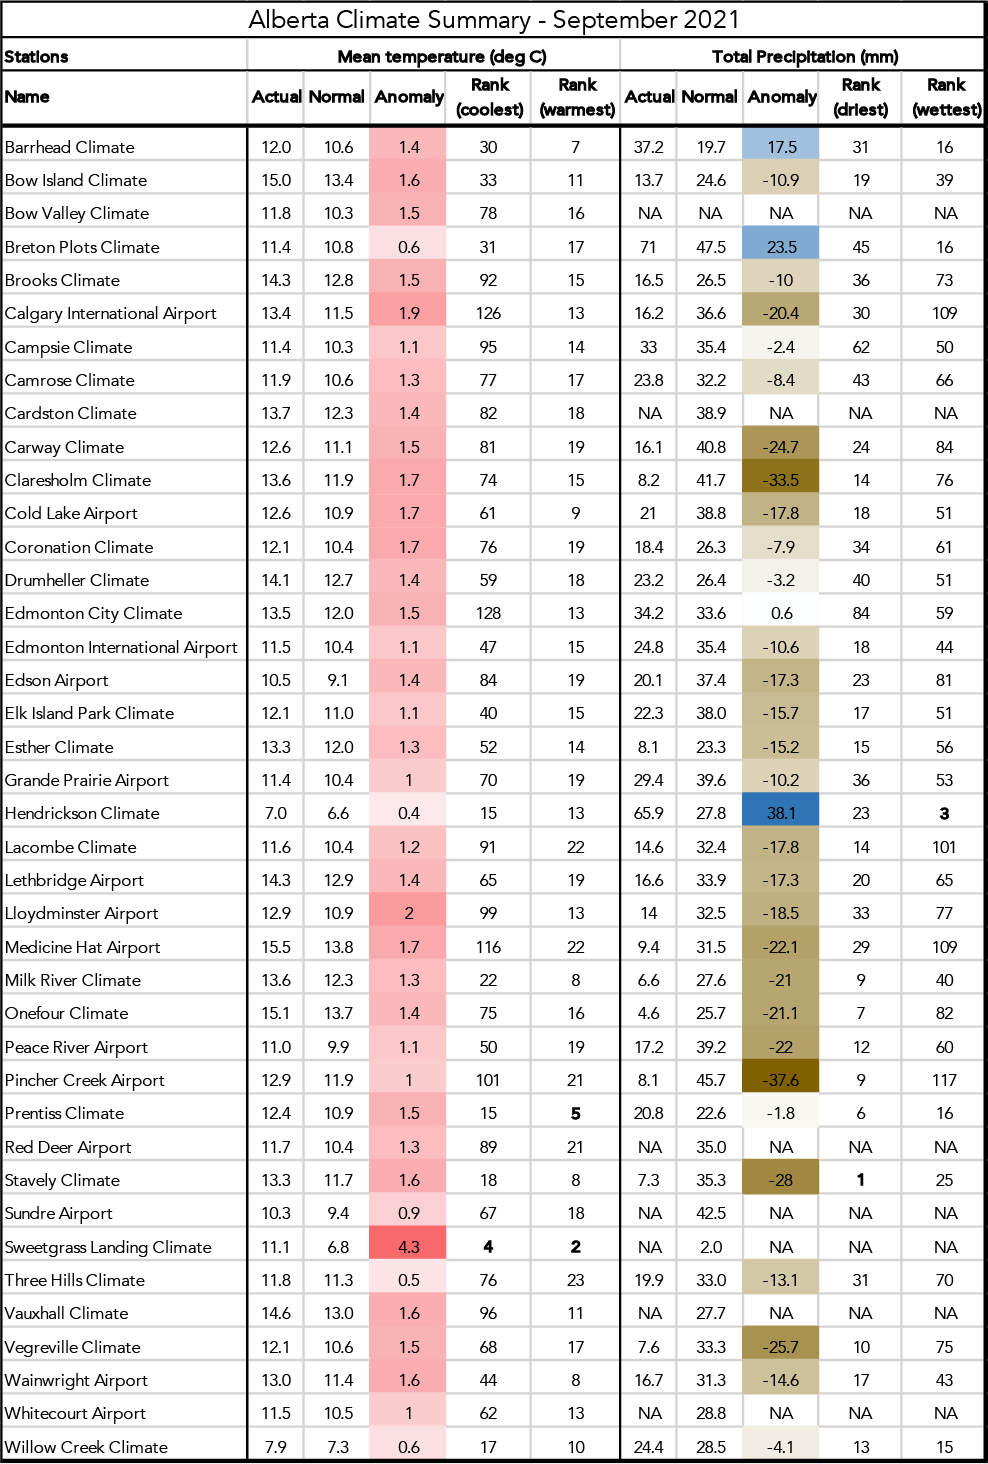
Alberta
- All but four stations in our Alberta summary were drier than normal in September
- Every station in our Alberta summary was warmer than normal
Monthly Data Tables
Using our proprietary climate database, we can provide weather or climate statistics for any location in Canada. Our climate summaries give a brief overview of the previous month’s weather in terms of mean temperatures and precipitation compared to normal. The following pages include monthly summaries for Manitoba, Saskatchewan, and Alberta. We are available to answer any questions or provide more detailed information.
Data Table Information
Actual – The actual mean temperature or total precipitation that occurred in the given month.
Normal – The 30-yr average mean temperature or total precipitation for the given month. We currently use the 1991-2020 period to calculate normal values.
Anomaly – The difference between the actual value and the normal value. Positive values indicate higher than normal, negative are lower than normal.
Rank – The all-time rank of the given month for the location. A value of 1 indicates that the value is the warmest/driest on record at that location. Any locations with a rank in the top-5 all-time for that month are in bold.
Looking for More Information?
If you need more information, don’t hesitate to contact us. We are experts in weather and climate data.