Hot Summer Ends; Rain Arrives
The Weatherlogics August weather story was the conclusion of a hot summer across the Prairies and the long-awaited arrival of significant rainfall. Calgary and Edmonton, AB both easily recorded their hottest summers on record, with mean temperatures of 18.3 C and 19.1 C, respectively. Saskatoon had its 2nd hottest summer, while Winnipeg, MB had its 4th hottest summer. Rainfall was much higher across the Prairies in August, with several weather systems causing all stations in Manitoba to have more rain than normal in August. Many stations in Alberta and Saskatchewan also had more rain in August, but not all stations were wetter than normal.
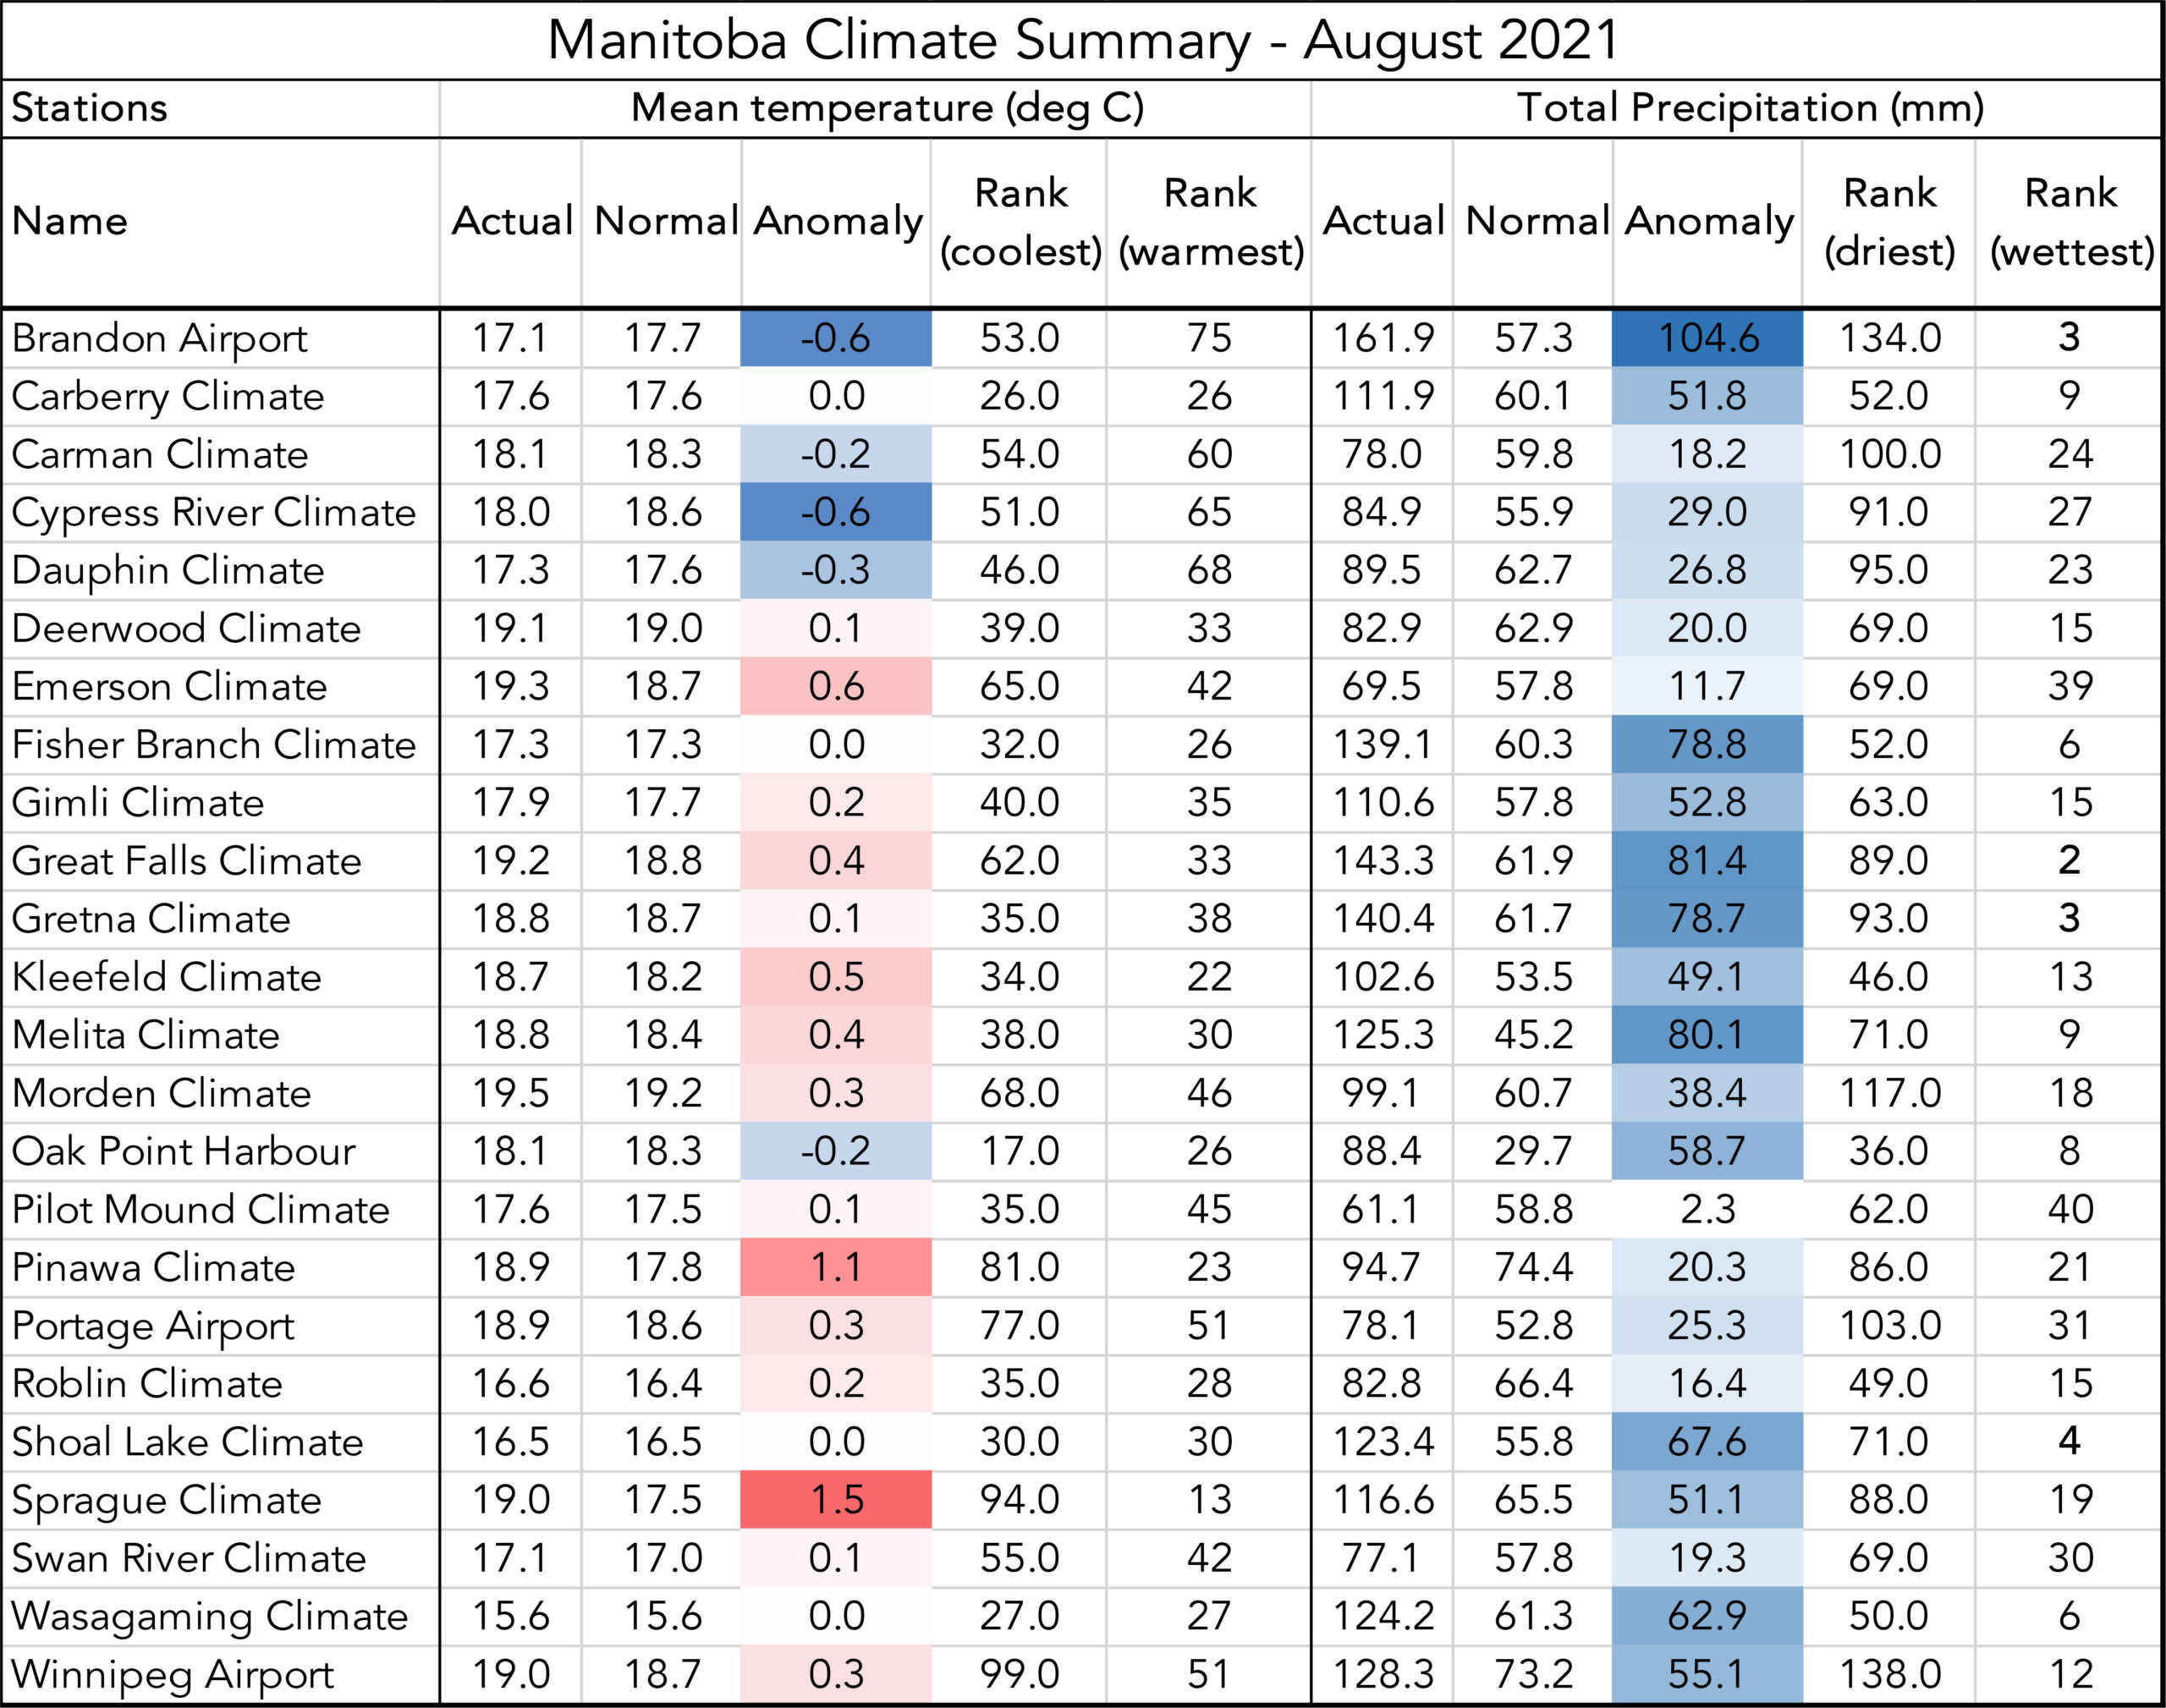
Manitoba
- Winnipeg, MB: 4th hottest summer (JJA) on record with a mean temperature of 20.3 C
- Winnipeg, MB: Wettest August since 2010 with 128.3 mm.
- Every station in Manitoba had above normal precipitation in August
- Brandon, MB: Most precipitation of any station in our summary in August with 161.9 mm. This was Brandon’s 3rd wettest August on record.
- Morden, MB: Warmest station in our summary with a mean temperature of 19.5 C
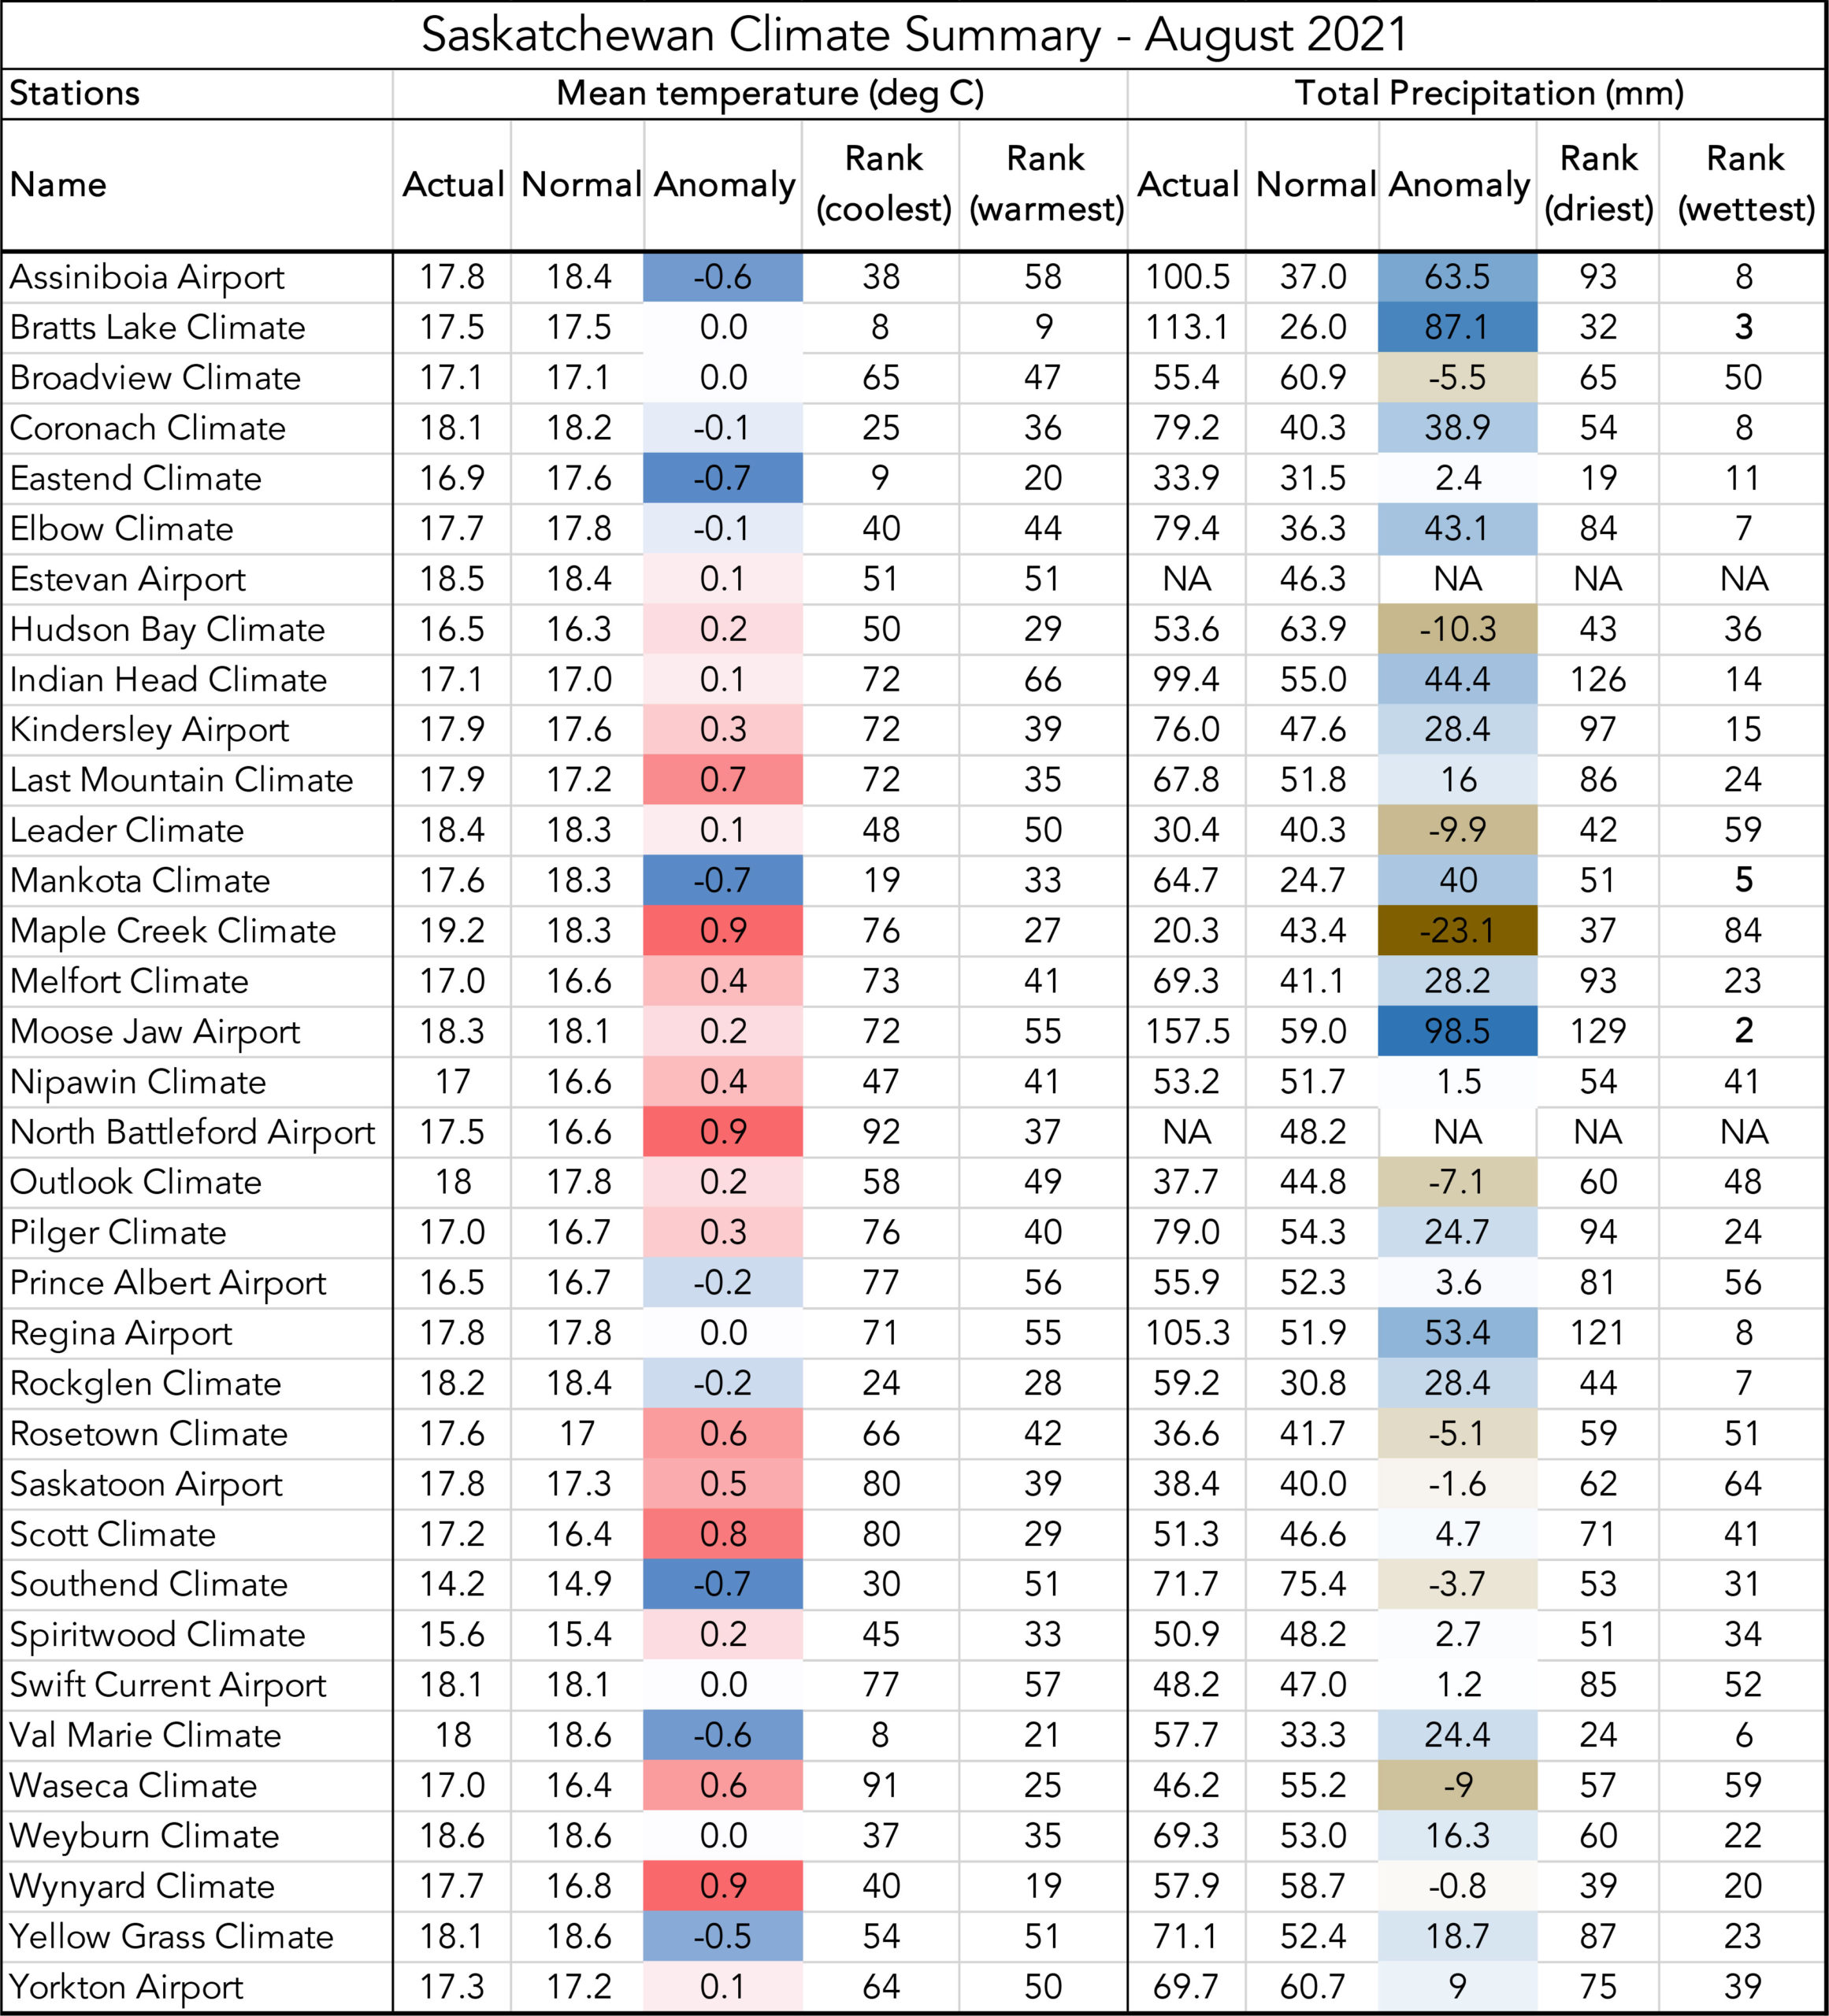
Saskatchewan
- Saskatoon, SK: 2nd hottest summer (JJA) on record, mean temperature 19.1 C
- Regina, SK: 7th hottest summer (JJA) on record, mean temperature 19.2 C
- Maple Creek, SK: Warmest station in our Saskatchewan summary with a mean temperature of 19.2 C
- All stations in our summary had mean temperatures within 1 C of normal in August
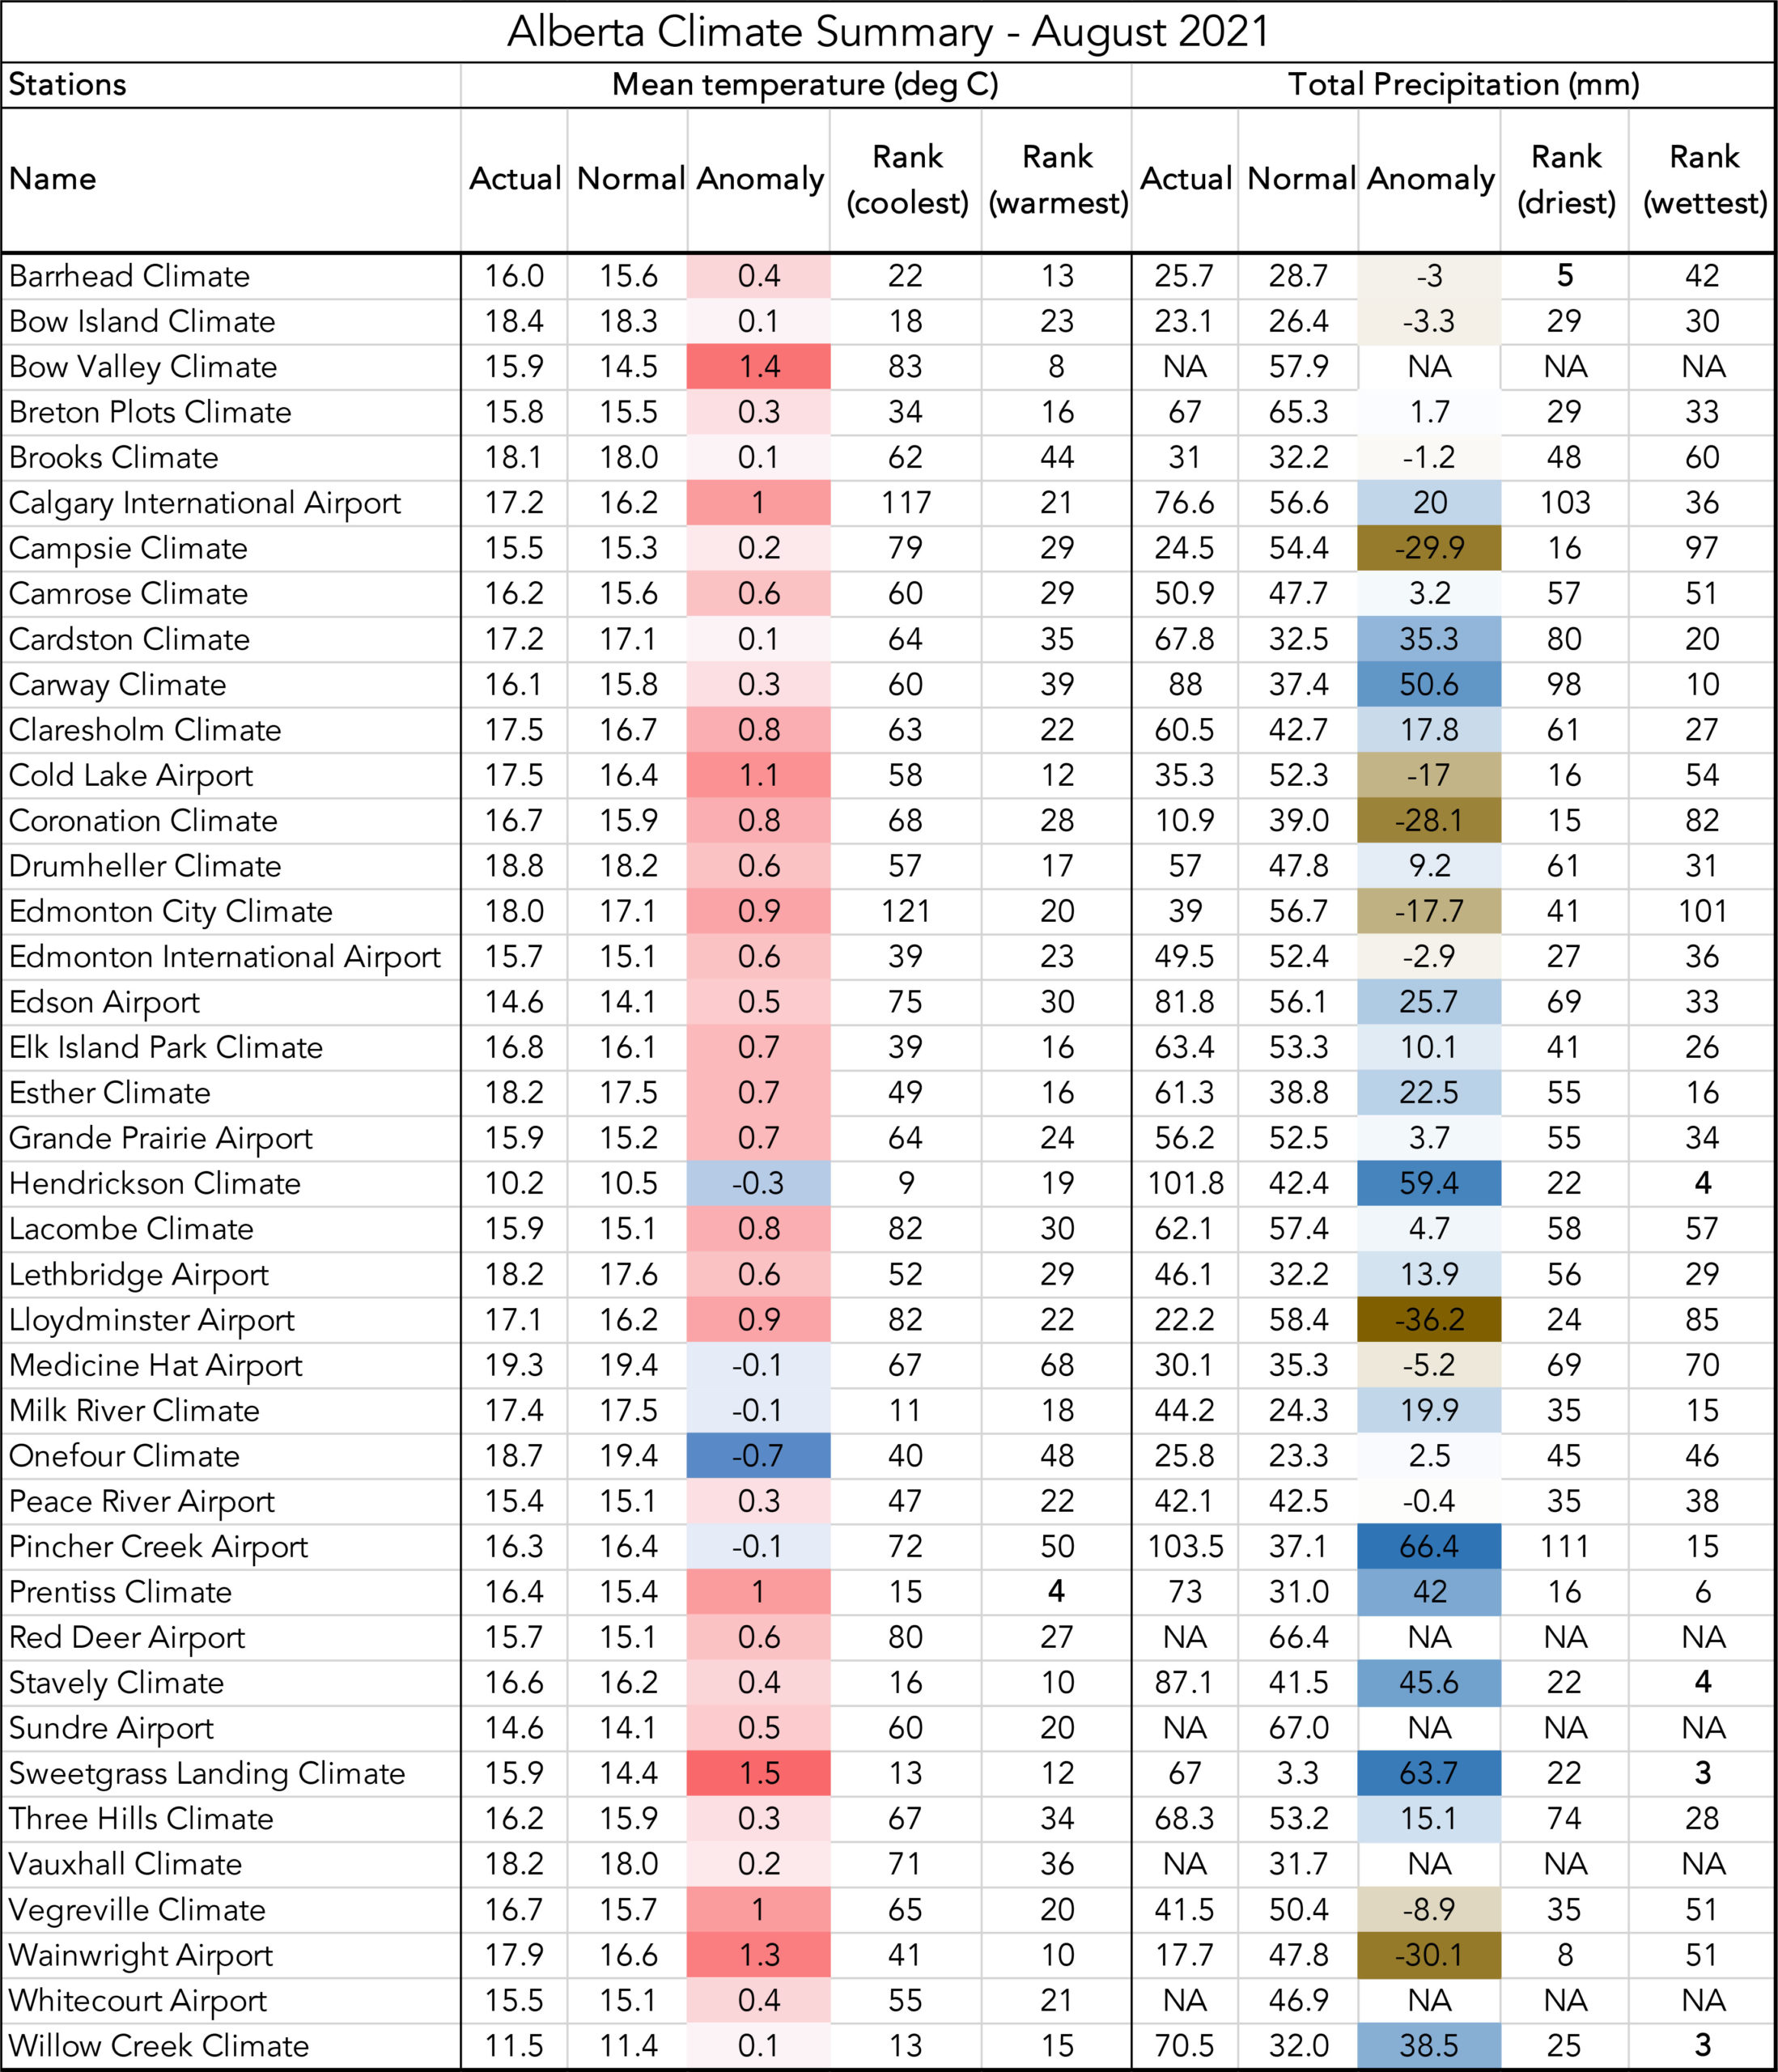
Alberta
- Calgary, AB: Hottest summer (JJA) on record, mean temperature 18.3 C
- Edmonton International Airport, AB: Second hottest summer on record, mean temperature 16.7 C
- Edmonton (City), AB: Hottest summer on record, mean temperature 19.1 C
- Medicine Hat, AB: Warmest station in our Alberta summary, mean temperature 19.3 C
- All but five stations (Hendrickson, Milk River, Pincher Creek, Onefour and Medicine Hat) in our summary were warmer than normal in August
Monthly Data Tables
Using our proprietary climate database, we can provide weather or climate statistics for any location in Canada. Our climate summaries give a brief overview of the previous month’s weather in terms of mean temperatures and precipitation compared to normal. The following pages include monthly summaries for Manitoba, Saskatchewan, and Alberta. We are available to answer any questions or provide more detailed information.
Data Table Information
Actual – The actual mean temperature or total precipitation that occurred in the given month.
Normal – The 30-yr average mean temperature or total precipitation for the given month. We currently use the 1991-2020 period to calculate normal values.
Anomaly – The difference between the actual value and the normal value. Positive values indicate higher than normal, negative are lower than normal.
Rank – The all-time rank of the given month for the location. A value of 1 indicates that the value is the warmest/driest on record at that location. Any locations with a rank in the top-5 all-time for that month are in bold.
Looking for More Information?
If you need more information, don’t hesitate to contact us. We are experts in weather and climate data.