Hot and Dry
The Weatherlogics July weather story was the hot and dry weather across the Prairies. Winnipeg, MB set a new record for driest July with only 8.5 mm in the entire month. In addition, Winnipeg has recorded 26 days so far this year with high temperatures of 30 C or higher. If the city records another 9 days with high temperatures 30 C or higher, it will tie the all-time record of 35 set in 1988. Elsewhere, dry hot and dry conditions were also prevalent. Calgary had its hottest July on record and Edmonton had its second hottest July. Below is a summary of other key statistics:
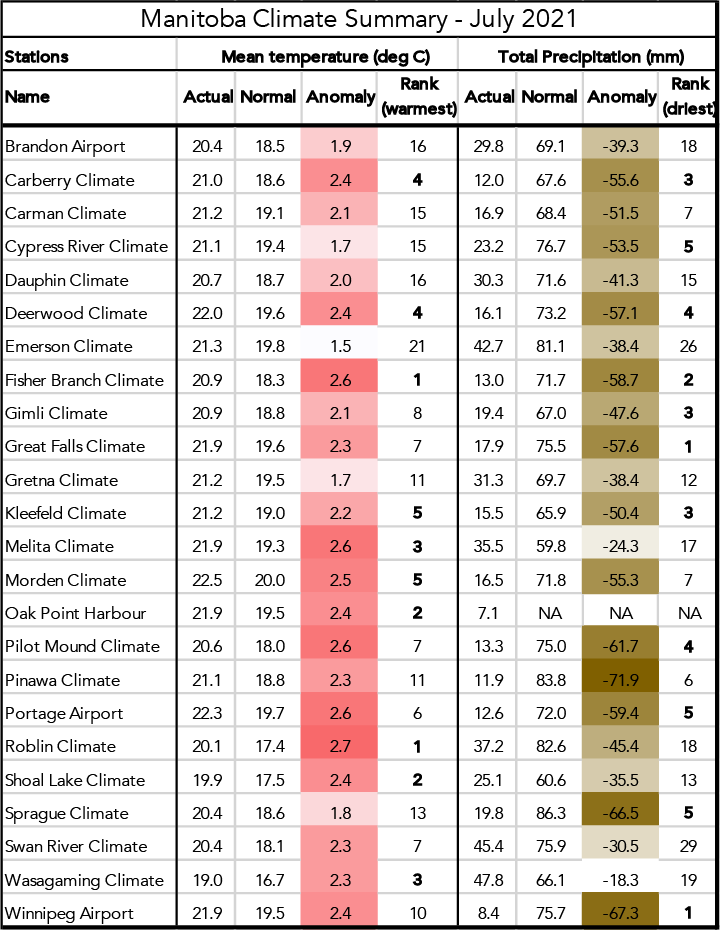
Manitoba
- Winnipeg, MB: Driest July on record with only 8.5 mm
- Winnipeg, MB: A total of 26 days with max temperatures greater than 30 C so far this year, only 9 below the record of 35 in 1988
- Fisher Branch and Roblin, MB had their hottest July’s on record
- Every station in our summary had below-normal precipitation in July
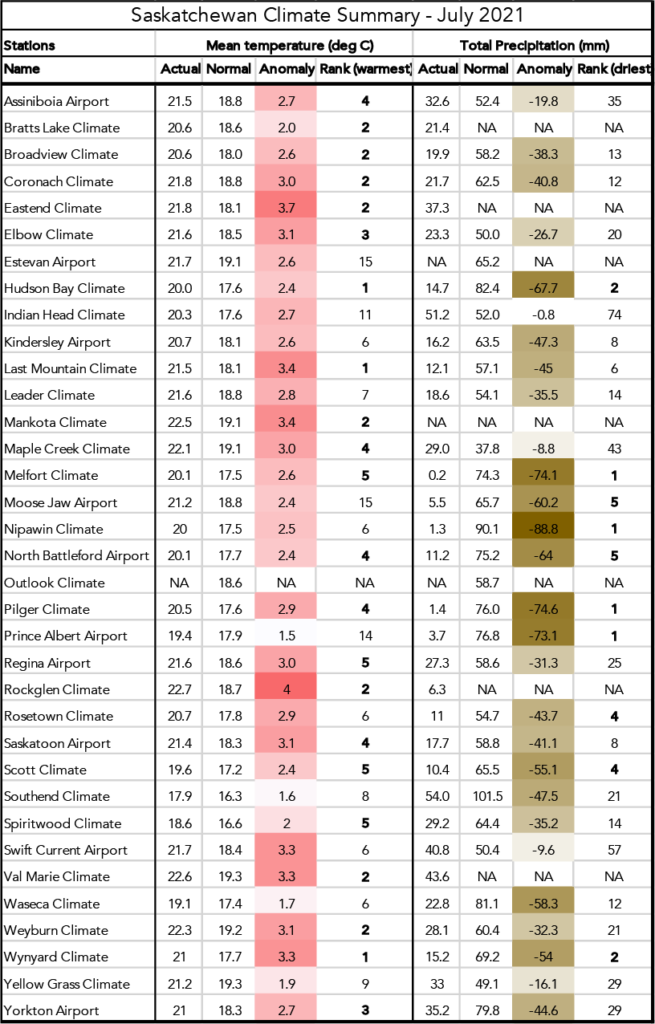
Saskatchewan
- Regina, SK: Fifth hottest July on record, mean temperature 21.6 C
- Saskatoon, SK: Fourth hottest July on record, mean temperature 21.4 C
- Hudson Bay, Last Mountain, and Wynyard, SK had their hottest July’s on record
- Every station in our summary had below-normal precipitation in July
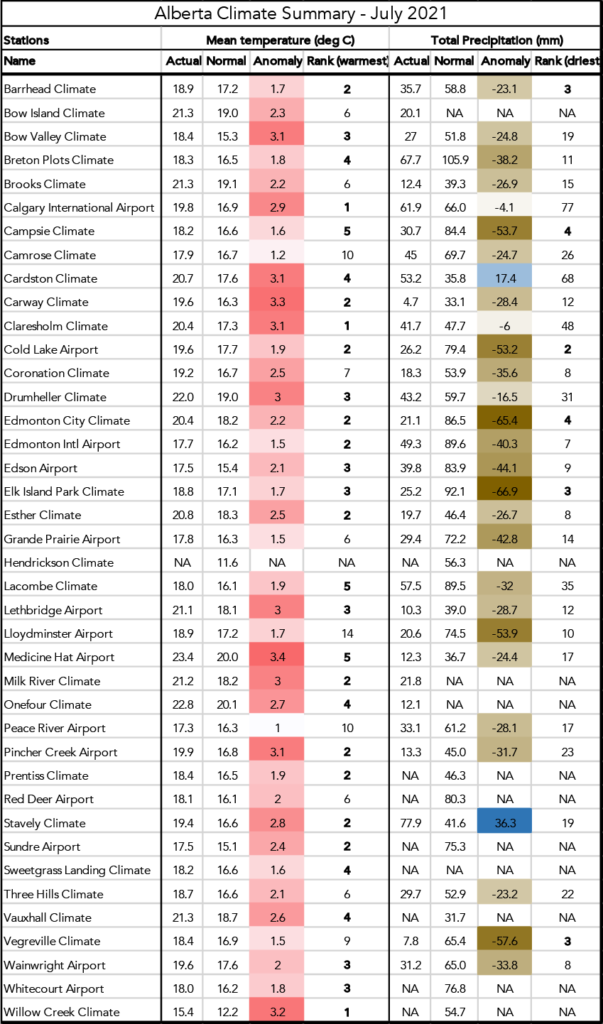
Alberta
- Calgary, AB: Hottest July on record, mean temperature 19.8 C
- Edmonton, AB: Second hottest July on record, mean temperature 20.4 C
- Claresholm and Willow Creek, AB also had their hottest July’s on record
- All but two stations in our summary were drier than normal in July
Monthly Data Tables
Using our proprietary climate database, we can provide weather or climate statistics for any location in Canada. Our climate summaries give a brief overview of the previous month’s weather in terms of mean temperatures and precipitation compared to normal. The following pages include monthly summaries for Manitoba, Saskatchewan, and Alberta. We are available to answer any questions or provide more detailed information.
- Actual – The actual mean temperature or total precipitation that occurred in the given month.
- Normal – The 30-yr average mean temperature or total precipitation for the given month. We currently use the 1991-2020 period to calculate normal values.
- Anomaly – The difference between the actual value and the normal value. Positive values indicate higher than normal, negative are lower than normal.
- Rank – The all-time rank of the given month for the location. A value of 1 indicates that the value is the warmest/driest on record at that location. Any locations with a rank in the top-5 all-time for that month are in bold.
Looking for More Information?
If you need more information, don’t hesitate to contact us. We are experts in weather and climate data.