App Resources
We’ve created some resources to help customers get started using the Weatherlogics App.
Please browse the sections below and don’t hesitate to contact us with any questions.


![]() Set your favourite view by clicking on the star icon in the app toolbar.
Set your favourite view by clicking on the star icon in the app toolbar.
![]() The solid star icon indicates that the current view is set as your favourite.
The solid star icon indicates that the current view is set as your favourite.
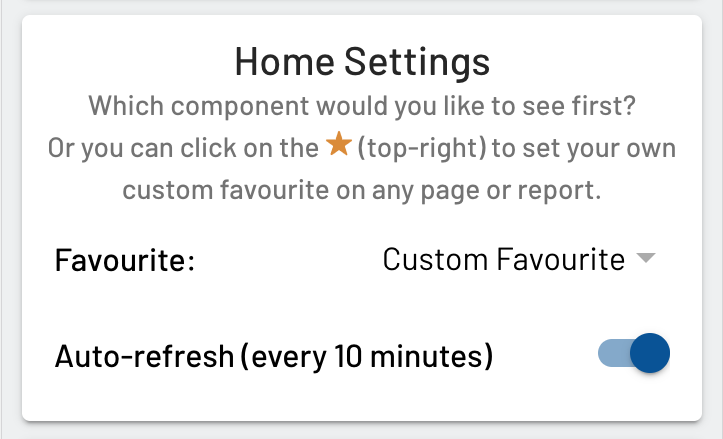
The favourite can also be selected on the Settings page under ‘Home Settings’. The Settings page is in the Profile Menu.
The default favourite page is Dashboard.
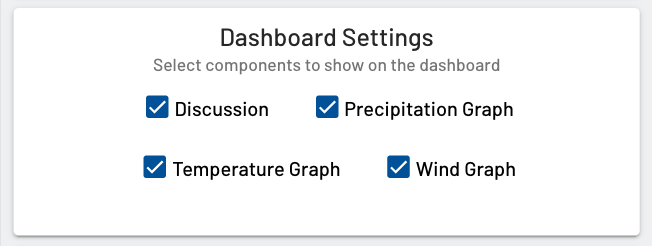
By default, this page displays the Discussion, 5 Day Forecast, and Graphs. You can customize what is displayed on this page: in the Profile Menu select Settings and look for the section Dashboard Settings.
The Discussion and 5 Day Forecast are based on your set forecast location on the Settings page. If you have more than one location, you can switch between them using the selection menu near the top of the graphs on the dashboard.
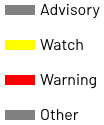 Warning: Click on a coloured section of the map to view government issued weather advisories, watches, and warnings.
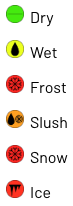 *RWIS: View road and weather information. *special feature – contact us for more info
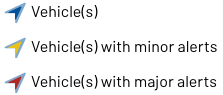 *Fleet: Click on a fleet icon to view live vehicle info and weather alerts. *special feature for the transportation industry – contact us for more info
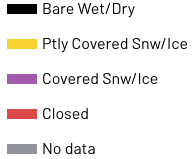 Road Condition: View current road condition data.
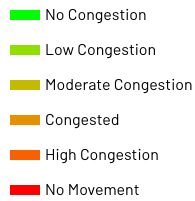 Traffic: View current traffic conditions.
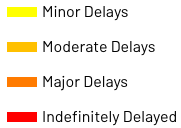 Construction: View current road information for delays and closures.
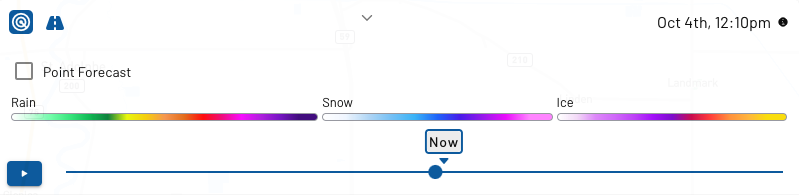 Radar: This panel view is displayed when the radar icon (upper left) is selected. Click on the upper middle section of the panel to expand and collapse the radar legends. The currently selected time is displayed in the upper right. Use the play/pause button to control the radar animation. You can also click or drag the time selector to a specific time. Clicking on the Now button will retrieve the most recent radar image. The radar layer can be used with any of the map layers and Point Forecast as well.
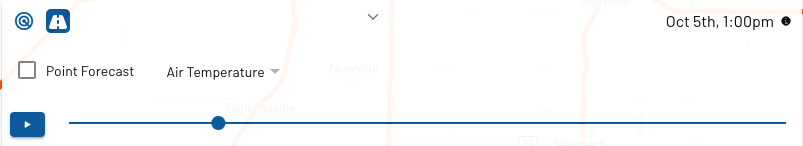 Road Forecast: This panel view is displayed when the Road Forecast (second icon upper left) is selected. Note the radar legends are hidden in this view. The selector for the road forecast type appears in the second row next to the Point Forecast. A ‘none’ option is available if you would like no road layer styling or no layers on the map at all (turning off map layers as well). Use the play/pause button to control the road forecast animation. You can also click or drag the time selector circle to a specific forecast time. Collapse the panel by clicking on the upper middle section for a more compact view.
Point Forecast: Selecting this option will display your forecast location(s) on the map. Clicking on the location icon
Road Forecast: This panel view is displayed when the Road Forecast (second icon upper left) is selected. Note the radar legends are hidden in this view. The selector for the road forecast type appears in the second row next to the Point Forecast. A ‘none’ option is available if you would like no road layer styling or no layers on the map at all (turning off map layers as well). Use the play/pause button to control the road forecast animation. You can also click or drag the time selector circle to a specific forecast time. Collapse the panel by clicking on the upper middle section for a more compact view.
Point Forecast: Selecting this option will display your forecast location(s) on the map. Clicking on the location icon 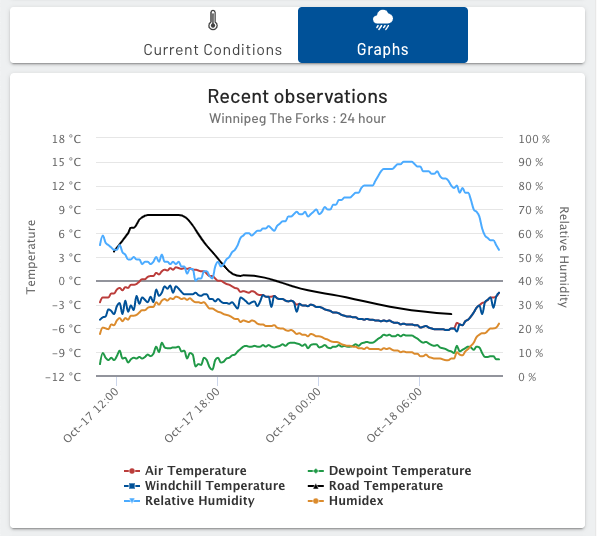 Under the graphs section you can view charts of past weather data about temperature, wind, precipitation, and more.
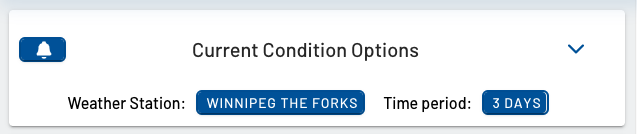
 The precip row has a toggle expansion with detailed information.
In the options panel you can view past weather data using the archives date selection button. If you have more than one forecast location you can also select from them.
The precip row has a toggle expansion with detailed information.
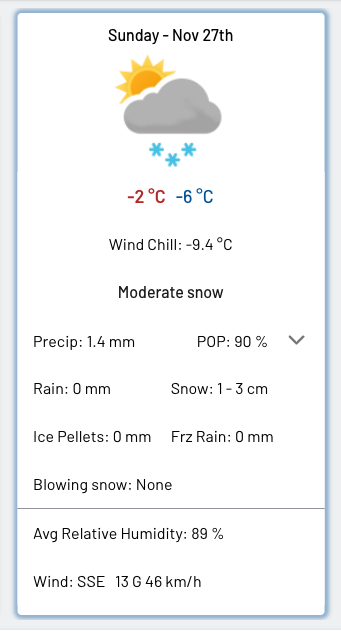
In the options panel you can view past weather data using the archives date selection button. If you have more than one forecast location you can also select from them.This table displays a summary of forecasted weather conditions hourly for your selected forecast location.
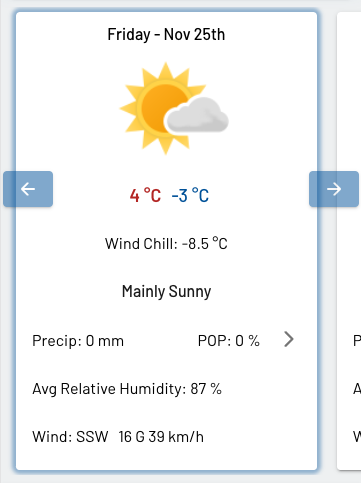
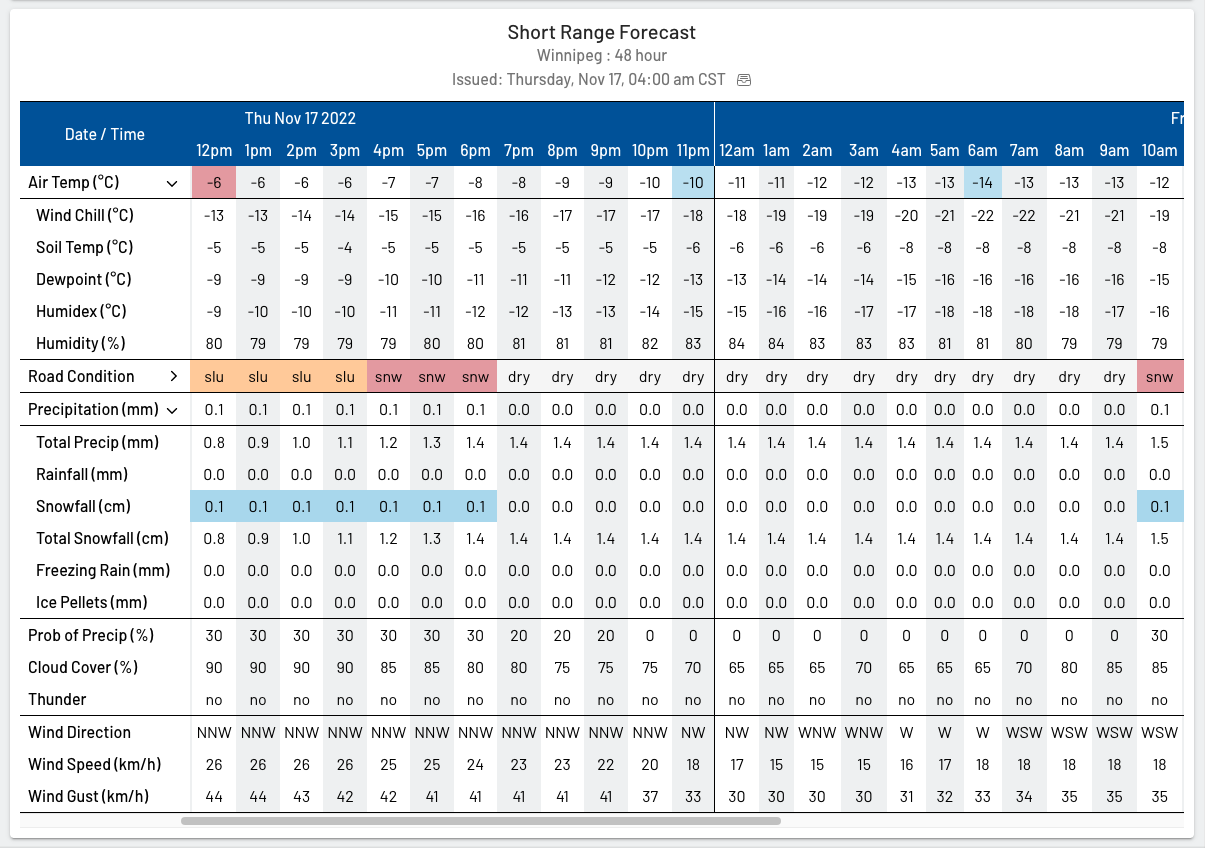 Click on a row with the forward arrow icon for more information.
 The weather information is displayed hourly for the next 48 hours by default. Alternatively, you can view the forecast in 3 hour increments for the next 120 hours. Refer to the time period selection in the options panel to make these changes.
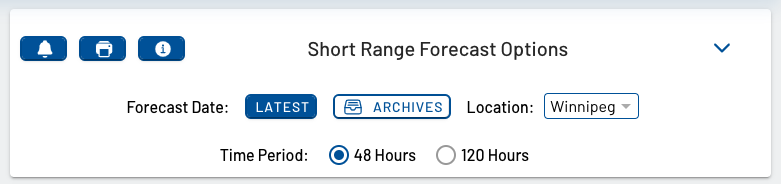
In the options panel you can quickly create a custom forecast alert by clicking on the bell icon in the upper left. Next to this icon there is an option to print the forecast, and an icon for the road condition legend.
View past forecasts by selecting a date using the archives button. If you have more than one forecast location you can select from them.
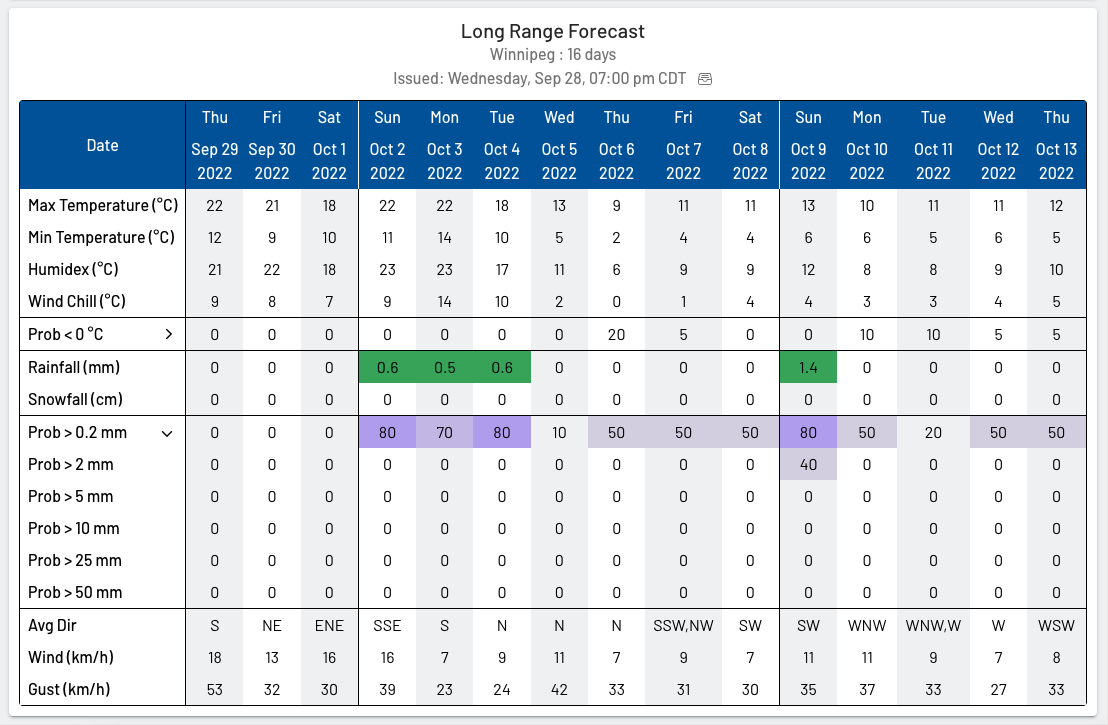 The rows with the forward icons can be expanded for more information.
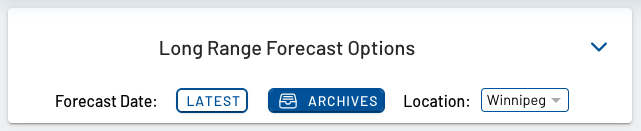 In the expandable section of the options panel you can view past forecasts by selecting a date using the archives button. If you have more than one forecast location you can select from them.
Ag Risk has three forecast tables: Frost, Disease and Spray. You can select between them clicking on their tab.
The Frost table is displayed by default, and includes a daily summary of forecasted air temperature and the freeze type severity for the next week.
The Disease table shows the forecasted risk for common crop diseases that occur across the prairies.
The Spray table shows a summary of the four main forecasted weather conditions that directly impact the success of spray applications. The spray forecast row summarizes these conditions so you can easily determine the best time of day. Weatherlogics’s forecast also uniquely shows the inversion strength to help you make effective applications.This conditions are displayed in 3 hour increments up to 84 hours.
In the expandable section of the options panel you can view past forecasts using the archive button, or select from different forecast locations if you have more than one.
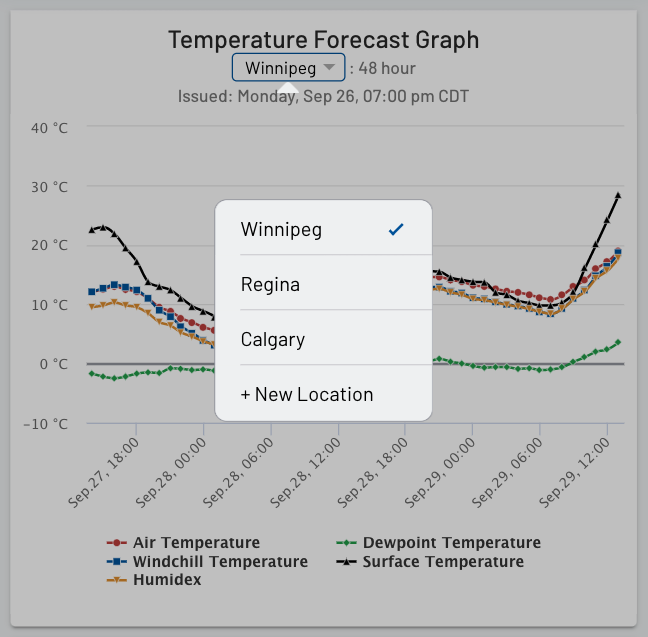
Interactive Graphs for temperature, precipitation, and wind can be viewed by clicking on their tabs.
The temperature graph is displayed by default showing forecasted values for the next 48 hours at your selected location.
Click on the graph to view the values. Toggle on and off the graph lines by clicking on their labels below the graph.
In the upper left of the options panel their is a bell icon that can be used to create a forecast alert. Next to it is an icon for printing the report.
In the expandable section of the options panel you can use the archives button to view past forecasts. If you have more than one forecast location you can select between them. You can also view a longer forecast by selecting the 120 hours time period option.
Provincial weather maps for Alberta, Saskatchewan, and Manitoba. Including 5 day forecast maps for max and min temperature, rainfall, and snowfall. A wind map for every 6 hours for the next 48 hours, and summary maps for hail and frost.
Use the time control slider above the forecast maps to view the next report.
In the expandable section of the options panel you can use the archives button to view past forecasts. Use the map type and province selectors to switch between options.
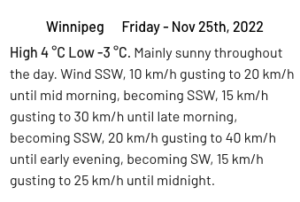
A meteorologist written weather summary for your region.
Click on the discussion title to expand and collapse the text.
In the expandable section of the options panel you can use the archives button to view past weather discussions.
Create custom weather alerts for observed weather station conditions, forecasted conditions for a specific location, or forecasted conditions along a route. You will receive notifications for your custom alerts within the app – these can be accessed by clicking on the bell icon in the top toolbar. Each notification is linked to a part of the app with related information. Also within the notification menu, there is a shortcut to the My Alerts page. To receive notifications via text message or email – fill out the values at the top of the My Alerts page and make sure they are toggled on.
To create an alert, view the carousel of alert type examples under the ‘Create New Alert’ tab (this section can be toggled). Click on the ‘Create Alert’ button at the bottom of each example. Complete the alert fields and save the alert – it will now appear under the ‘Edit Your Alerts’ section which can be collapsed by clicking on it. Your created alerts can be edited by clicking on them. In the edit view you can change values and save them by clicking ‘Update’ button.To permanently delete the alert click the delete button. To stop receiving notifications for the alert archive it by switching the ‘Active’ toggle to ‘Inactive’.