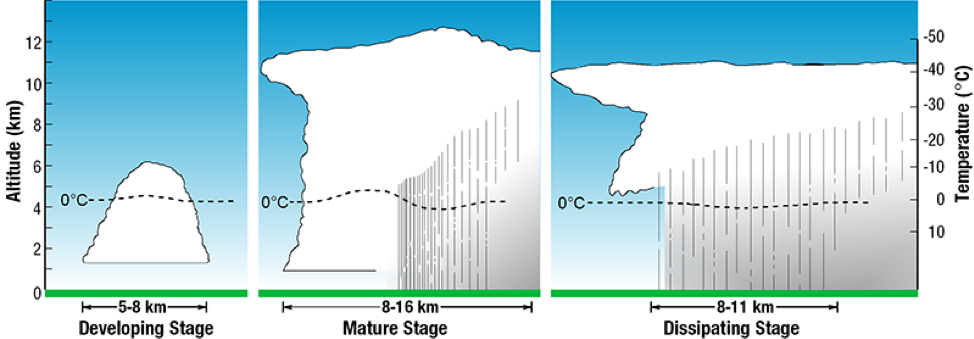
When forecasting the potential for hail, the first thing we look for is the potential for thunderstorm activity and the type of thunderstorms that are expected to develop. As mentioned in part 2 of this series, supercell thunderstorms tend to produce the largest hail and thus, there is a greater risk for hail damage when there is the potential for supercell thunderstorms. This is because supercells tend to have stronger updrafts, which are required to keep hailstones in the cloud for sufficient amounts of time for them to grow. Supercells tend to develop in a highly unstable atmosphere with adequate wind shear to separate the downdraft and updraft regions, which promotes longevity of the storm.
The depth of the melting layer is also an important factor for determining if hail will melt completely before reaching the surface. The height of the wet-bulb zero can help with forecasting the potential for hail to reach the surface in thunderstorms. The wet-bulb temperature is the temperature at which a surface has cooled due to evaporation of liquid water. Thus, the wet-bulb temperature can be an estimate of the temperature of a precipitation particle as it falls through the atmosphere. We use the wet-bulb temperature because as the particle falls, evaporation is occurring on the wet surface of the particle. Generally, a height of about 2.1 km to 3.2 km (9,000-10,5000 ft) of the wet-bulb zero correlates well with large hail at the surface (source: NOAA Glossary). In the tropics, where the melting layer is deeper, large hail is less common than in the mid-latitudes.
The presence or absence of a layer of dry air in the middle part of the atmosphere is also taken into consideration when forecasting hail. Cooling from evaporation of water and melting of hailstones in this dry layer can lower the wet-bulb zero height inside a thunderstorm cloud, decreasing the depth of the melting layer and increasing the likelihood of large hail.
Surface elevation also affects the likelihood of hail. Higher elevations, such as the Alberta Foothills, result in thinner melting layers and less time for hailstones to melt. Hail is more frequent in these regions as a result.
Finally, the amount of water vapour in the atmosphere is considered. Generally, lower amounts of water vapour combined with a highly unstable atmosphere are more favourable for large hail. A highly moist atmosphere results in more liquid being present in the storm cloud, which reduces the speed of the updraft, thereby not allowing hail to remain suspended for as long.
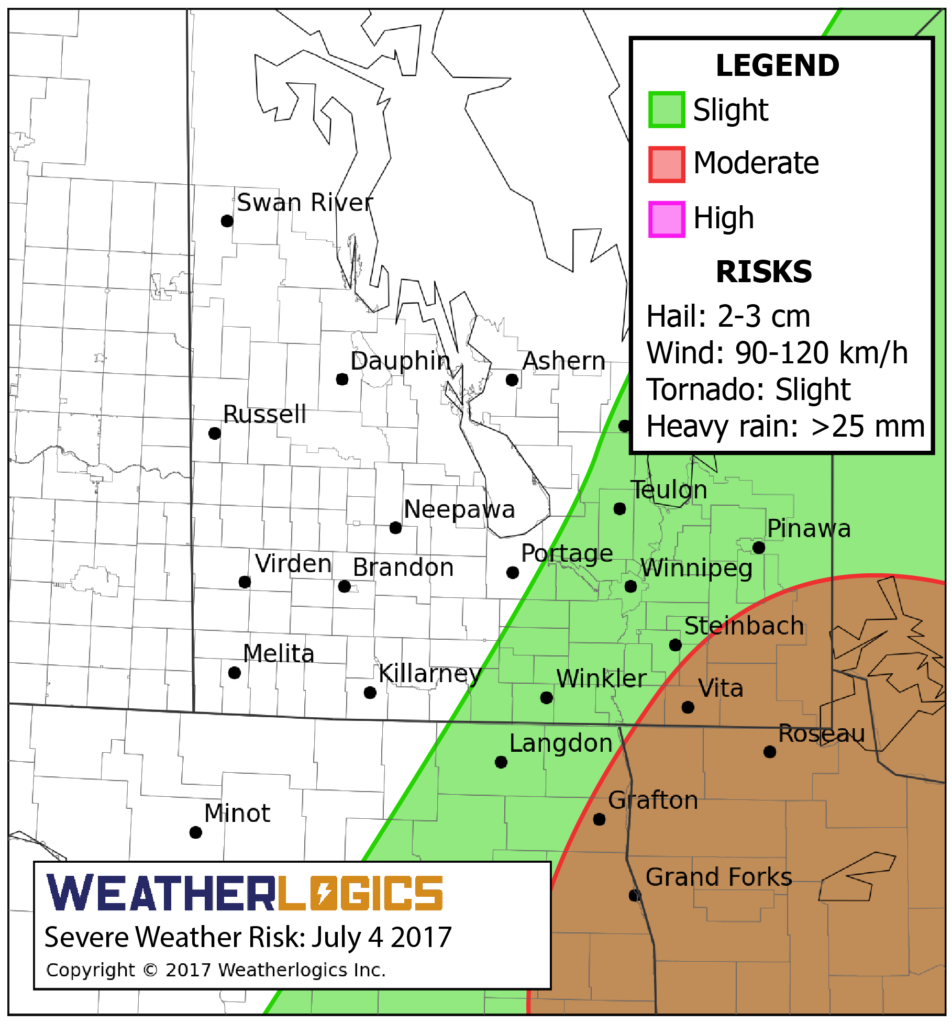
By considering all these factors, the meteorologists at Weatherlogics are able to produce daily hail forecasts. We identify where hail is likely to occur, and how large it could get. The image above shows one of our severe weather outlook graphics from 2017. That graphic indicates the potential for hail, in addition to damaging winds, heavy rain, and tornadoes. Each forecast graphic is accompanied by a synopsis which describes the meteorological conditions. This information helps give hail-exposed sectors advance warning of damage potential. Once a hail storm has developed, we track the storm closely and gather information about it. Our hail data can be used to verify insurance claims and identify which areas were most impacted by a storm.
Thank-you for reading this series about hail. If you’d like to continue the conversation, feel free to contact us at info@weatherlogics.com. You can also visit our insurance page for more information about our hail data. We would love to show you how our hail data and forecasts can help you manage your weather risk.